Visible to Intel only — GUID: iga1423336626008
Ixiasoft
3.4.2.1. The status Register
3.4.2.2. The estatus Register
3.4.2.3. The bstatus Register
3.4.2.4. The ienable Register
3.4.2.5. The ipending Register
3.4.2.6. The cpuid Register
3.4.2.7. The exception Register
3.4.2.8. The pteaddr Register
3.4.2.9. The tlbacc Register
3.4.2.10. The tlbmisc Register
3.4.2.11. The badaddr Register
3.4.2.12. The config Register
3.4.2.13. The mpubase Register
3.4.2.14. The mpuacc Register
3.6.3.1. Instruction Cache Tag RAM
3.6.3.2. Instruction Cache Data RAM
3.6.3.3. ITCMs
3.6.3.4. Register File RAM Blocks
3.6.3.5. Data Cache Tag RAM
3.6.3.6. Data Cache Data RAM (Clean Line)
3.6.3.7. Data Cache Data RAM (Dirty Line)
3.6.3.8. Data Cache Victim Line Buffer RAM
3.6.3.9. DTCMs
3.6.3.10. MMU TLB RAM
3.7.1. Terminology
3.7.2. Exception Overview
3.7.3. Exception Latency
3.7.4. Reset Exceptions
3.7.5. Break Exceptions
3.7.6. Interrupt Exceptions
3.7.7. Instruction-Related Exceptions
3.7.8. Other Exceptions
3.7.9. Exception Processing Flow
3.7.10. Determining the Cause of Interrupt and Instruction-Related Exceptions
3.7.11. Handling Nested Exceptions
3.7.12. Handling Nonmaskable Interrupts
3.7.13. Masking and Disabling Exceptions
3.7.7.1. Trap Instruction
3.7.7.2. Break Instruction
3.7.7.3. Unimplemented Instruction
3.7.7.4. Illegal Instruction
3.7.7.5. Supervisor-Only Instruction
3.7.7.6. Supervisor-Only Instruction Address
3.7.7.7. Supervisor-Only Data Address
3.7.7.8. Misaligned Data Address
3.7.7.9. Misaligned Destination Address
3.7.7.10. Division Error
3.7.7.11. Fast TLB Miss
3.7.7.12. Double TLB Miss
3.7.7.13. TLB Permission Violation
3.7.7.14. MPU Region Violation
3.9.1. Data Transfer Instructions
3.9.2. Arithmetic and Logical Instructions
3.9.3. Move Instructions
3.9.4. Comparison Instructions
3.9.5. Shift and Rotate Instructions
3.9.6. Program Control Instructions
3.9.7. Other Control Instructions
3.9.8. Custom Instructions
3.9.9. No-Operation Instruction
3.9.10. Potential Unimplemented Instructions
8.5.1. add
8.5.2. addi
8.5.3. and
8.5.4. andhi
8.5.5. andi
8.5.6. beq
8.5.7. bge
8.5.8. bgeu
8.5.9. bgt
8.5.10. bgtu
8.5.11. ble
8.5.12. bleu
8.5.13. blt
8.5.14. bltu
8.5.15. bne
8.5.16. br
8.5.17. break
8.5.18. bret
8.5.19. call
8.5.20. callr
8.5.21. cmpeq
8.5.22. cmpeqi
8.5.23. cmpge
8.5.24. cmpgei
8.5.25. cmpgeu
8.5.26. cmpgeui
8.5.27. cmpgt
8.5.28. cmpgti
8.5.29. cmpgtu
8.5.30. cmpgtui
8.5.31. cmple
8.5.32. cmplei
8.5.33. cmpleu
8.5.34. cmpleui
8.5.35. cmplt
8.5.36. cmplti
8.5.37. cmpltu
8.5.38. cmpltui
8.5.39. cmpne
8.5.40. cmpnei
8.5.41. custom
8.5.42. div
8.5.43. divu
8.5.44. eret
8.5.45. flushd
8.5.46. flushda
8.5.47. flushi
8.5.48. flushp
8.5.49. initd
8.5.50. initda
8.5.51. initi
8.5.52. jmp
8.5.53. jmpi
8.5.54. ldb / ldbio
8.5.55. ldbu / ldbuio
8.5.56. ldh / ldhio
8.5.57. ldhu / ldhuio
8.5.58. ldw / ldwio
8.5.59. mov
8.5.60. movhi
8.5.61. movi
8.5.62. movia
8.5.63. movui
8.5.64. mul
8.5.65. muli
8.5.66. mulxss
8.5.67. mulxsu
8.5.68. mulxuu
8.5.69. nextpc
8.5.70. nop
8.5.71. nor
8.5.72. or
8.5.73. orhi
8.5.74. ori
8.5.75. rdctl
8.5.76. rdprs
8.5.77. ret
8.5.78. rol
8.5.79. roli
8.5.80. ror
8.5.81. sll
8.5.82. slli
8.5.83. sra
8.5.84. srai
8.5.85. srl
8.5.86. srli
8.5.87. stb / stbio l
8.5.88. sth / sthio
8.5.89. stw / stwio
8.5.90. sub
8.5.91. subi
8.5.92. sync
8.5.93. trap
8.5.94. wrctl
8.5.95. wrprs
8.5.96. xor
8.5.97. xorhi
8.5.98. xori
Visible to Intel only — GUID: iga1423336626008
Ixiasoft
4.6. JTAG Debug Tab
The JTAG Debug tab presents settings for configuring the JTAG debug module on the Nios® II processor. You can select the debug features appropriate for your target application.
Figure 11. Nios® II Platform Designer JTAB Debug Tab
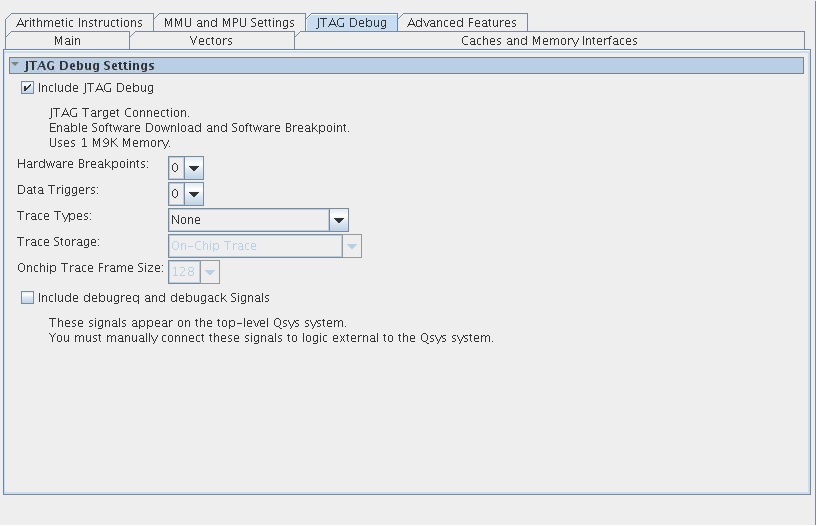
Soft processor cores such as the Nios® II processor offer unique debug capabilities beyond the features of traditional fixed processors. The soft nature of the Nios® II processor allows you to debug a system in development using a full-featured debug core, and later remove the debug features to conserve logic resources. For the release version of a product, you might choose to reduce the JTAG debug module functionality, or remove it altogether.
| Feature | Description |
|---|---|
| JTAG Target Connection | Connects to the processor through the standard JTAG pins on the Intel FPGA. This connection provides the basic capabilities to start and stop the processor, and examine/edit registers and memory. |
| Download Software | Downloads executable code to the processor’s memory via the JTAG connection. |
| Software Breakpoints | Sets a breakpoint on instructions residing in RAM. |
| Hardware Breakpoints | Sets a breakpoint on instructions residing in nonvolatile memory, such as flash memory. |
| Data Triggers | Triggers based on address value, data value, or read or write cycle. You can use a trigger to halt the processor on specific events or conditions, or to activate other events, such as starting execution trace, or sending a trigger signal to an external logic analyzer. Two data triggers can be combined to form a trigger that activates on a range of data or addresses. |
| Instruction Trace | Captures the sequence of instructions executing on the processor in real time. |
| Data Trace | Captures the addresses and data associated with read and write operations executed by the processor in real time. |
| On-Chip Trace | Stores trace data in on-chip memory. |
| Off-Chip Trace | Stores trace data in an external debug probe. Off-chip trace instantiates a PLL inside the Nios II core. Off-chip trace requires a debug probe from Imagination Technologies or Lauterbach GmbH. |
The Include debugreq and debugack signals debug signals setting provides the following functionality. When on, the Nios® II processor includes debug request and acknowledge signals. These signals let another device temporarily suspend the Nios® II processor for debug purposes. The signals are exported to the top level of your Platform Designer system.
For more information about the debug signals, refer to the Processor Architecture chapter of the Nios® II Processor Reference Handbook.
You can set the onchip trace buffer size to sizes from 128 to 64K trace frames, using OCI Onchip Trace. Larger buffer sizes consume more on-chip M4K RAM blocks. Every M4K RAM block can store up to 128 trace frames.
Related Information