Frame Analysis: Analyze Frames for Performance Bottlenecks
Use Intel® GPA Graphics Frame Analyzer to identify bottlenecks in the graphics pipeline. Capture a stream (a sequence of frames), focus on a particular frame, and explore API calls and graphics resources of this frame.
To start frame analysis:
- Run Graphics Monitor by double-clicking the
 Graphics Monitor icon in the taskbar notification area or on the desktop.
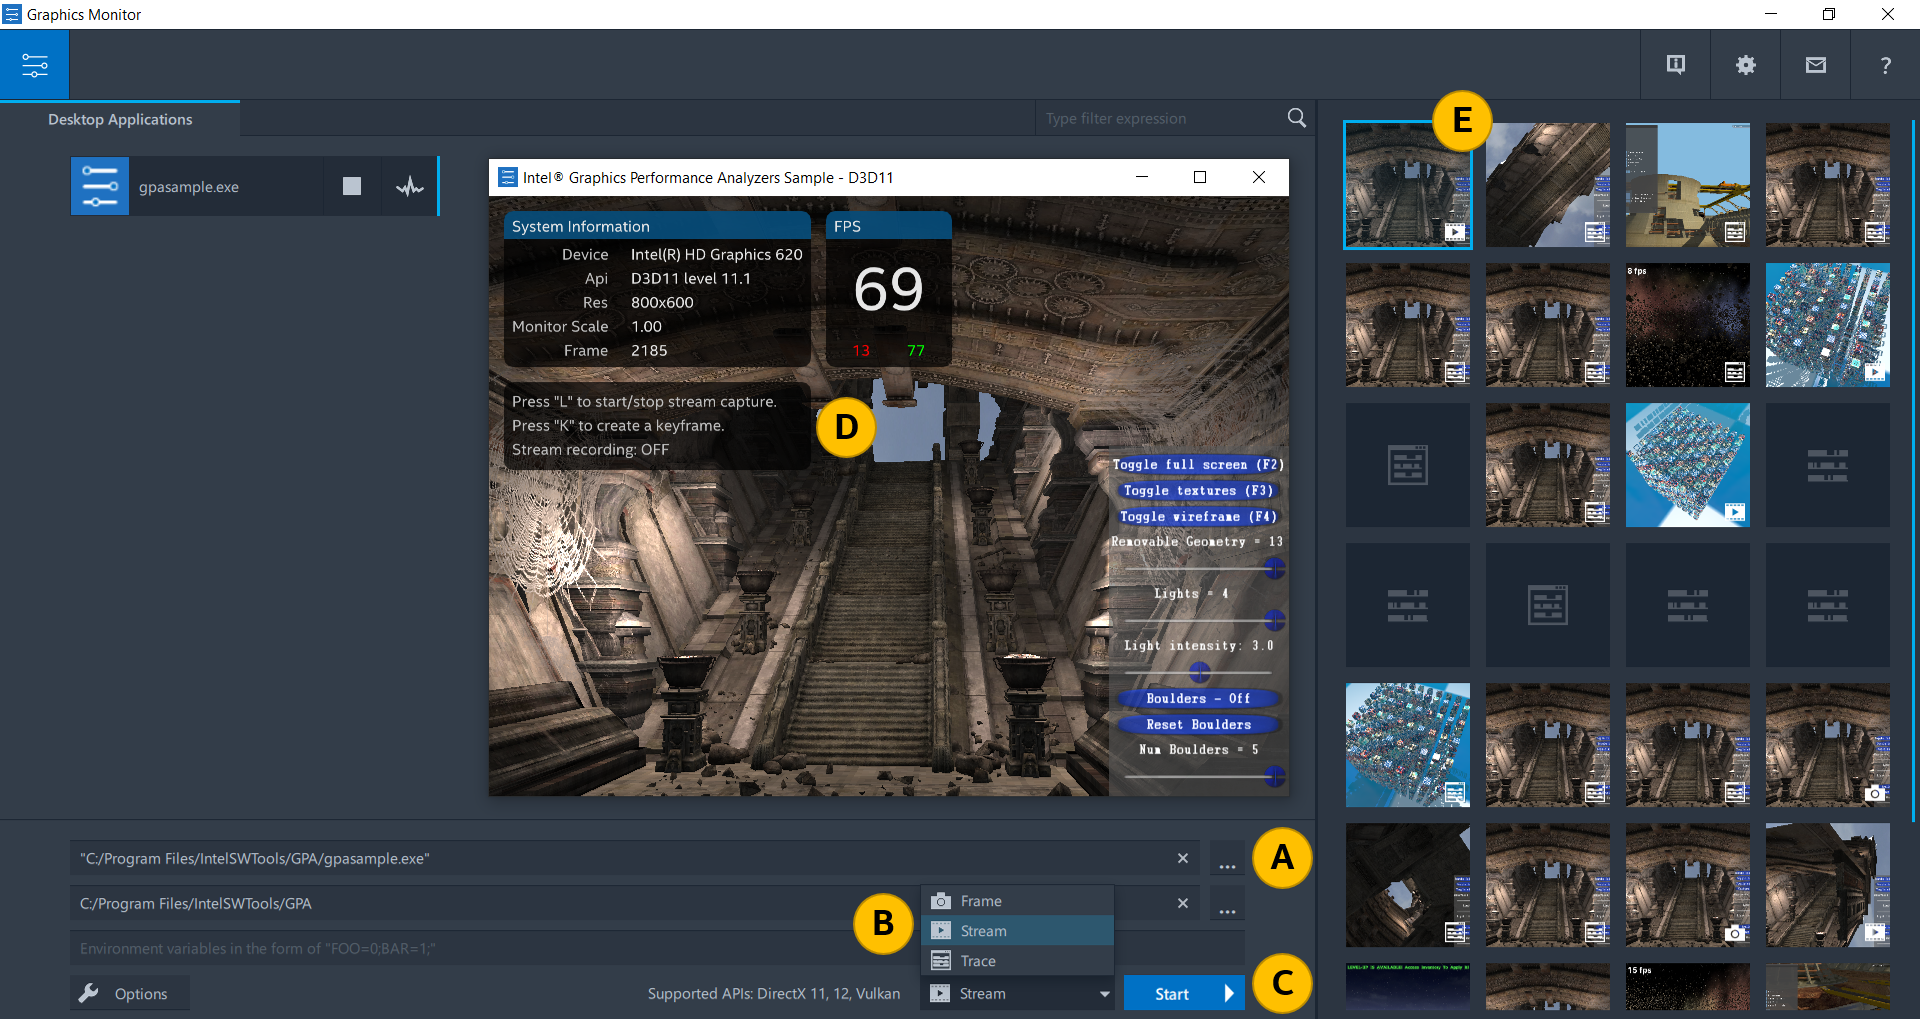
 - Specify the application for analysis by clicking the Browse
 button on the lower right and browsing to your application (
 ).
). On Windows, you can use the sample application gpasample.exe.
- Select the Stream startup mode from the drop-down menu on the lower right (
 ).
). - Run the application by clicking the Start button (
 ).
). The application launches in a separate window. By default, stream capture starts immediately when the application is started.
- Complete stream capture by pressing L (
 ).
). - Open the trace using the Open File ribbon of the Graphics Monitor window (
 ).
).
Multiframe View of Frame Analyzer opens.
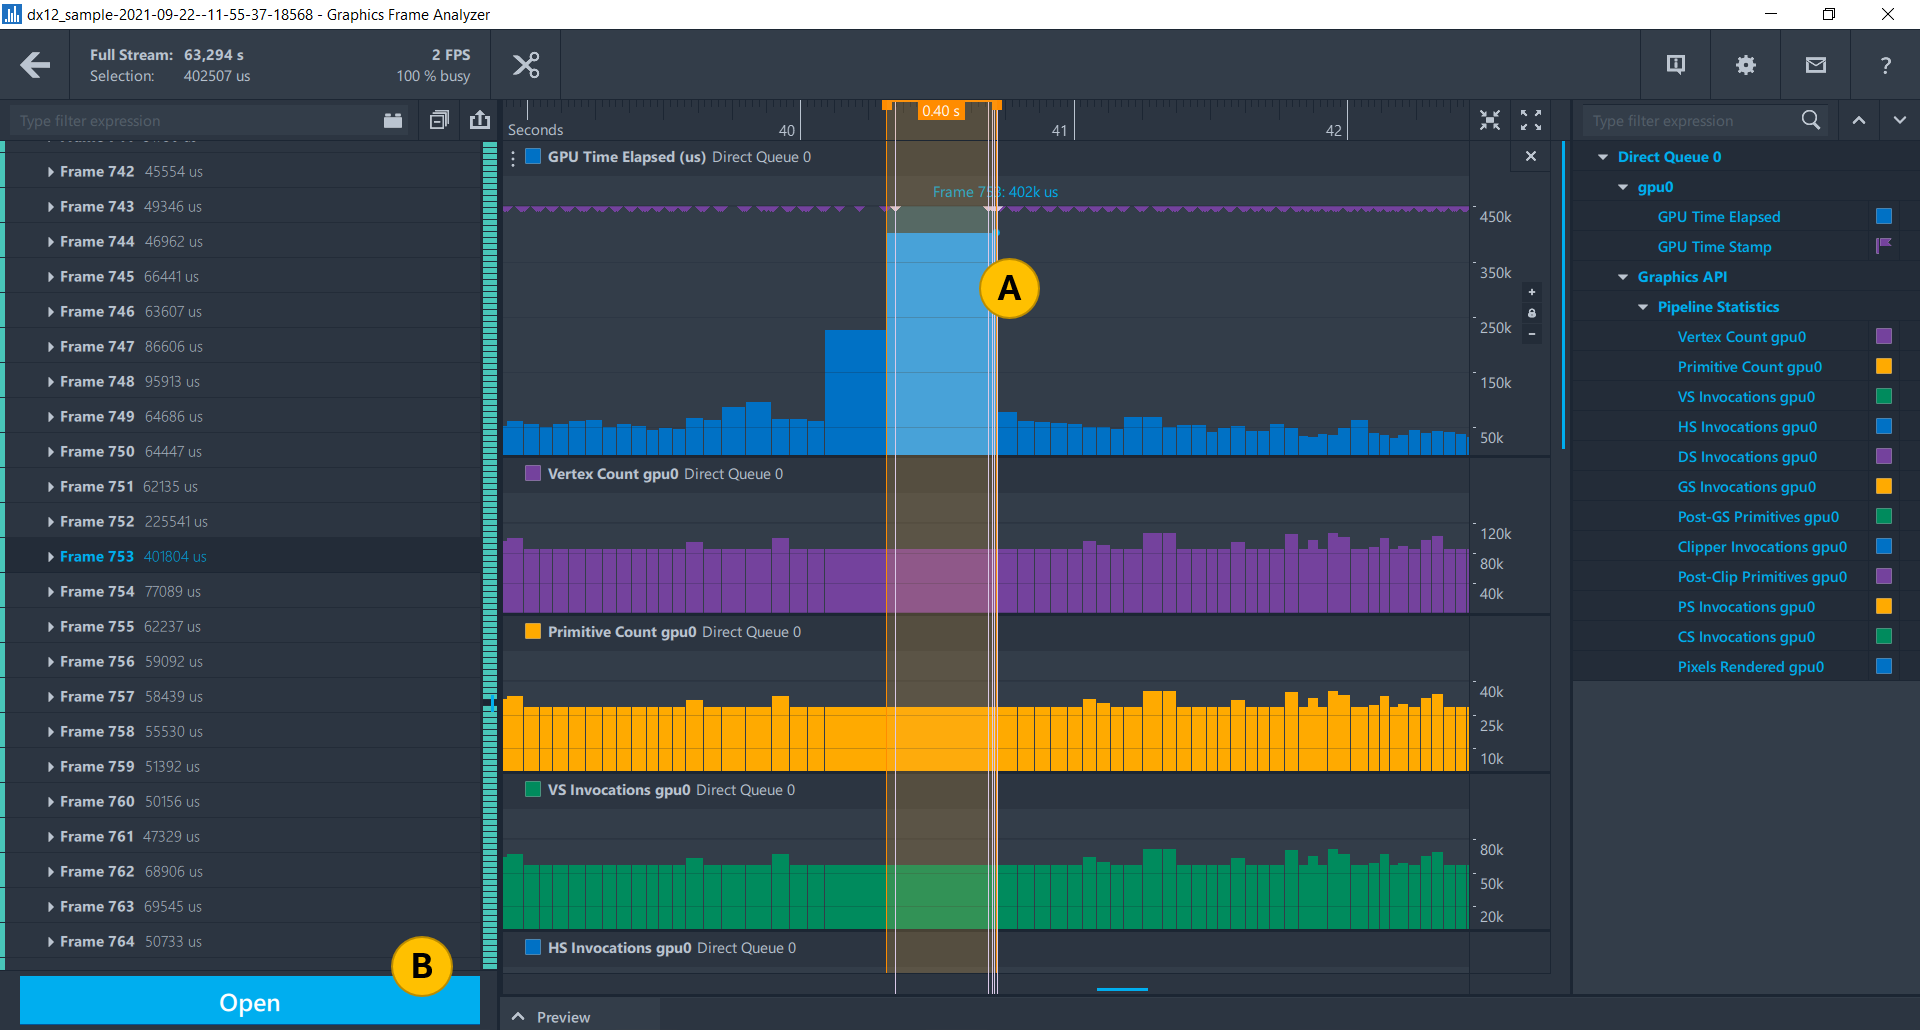
- For detailed analysis, open a frame that appears to perform poorly. For example, identify the longest frame by analyzing the GPU Time Elapsed metric, which shows the amount of time spent on frame rendering:
- On the GPU Time Elapsed track, click the longest frame ().
- Click the Open button on the lower left ().
Profiling View window of Frame Analyzer opens.
- On the GPU Time Elapsed track, click the longest frame (
- Start analysis with the Advanced Profiling Mode, which allows you to identify potential bottlenecks. Click the
 Advanced Profiling Mode button on the top left.
 The API calls are grouped by bottlenecks on the Visualization (
) and API Log () panes. The first group of draw calls is the most impactful and time-consuming.
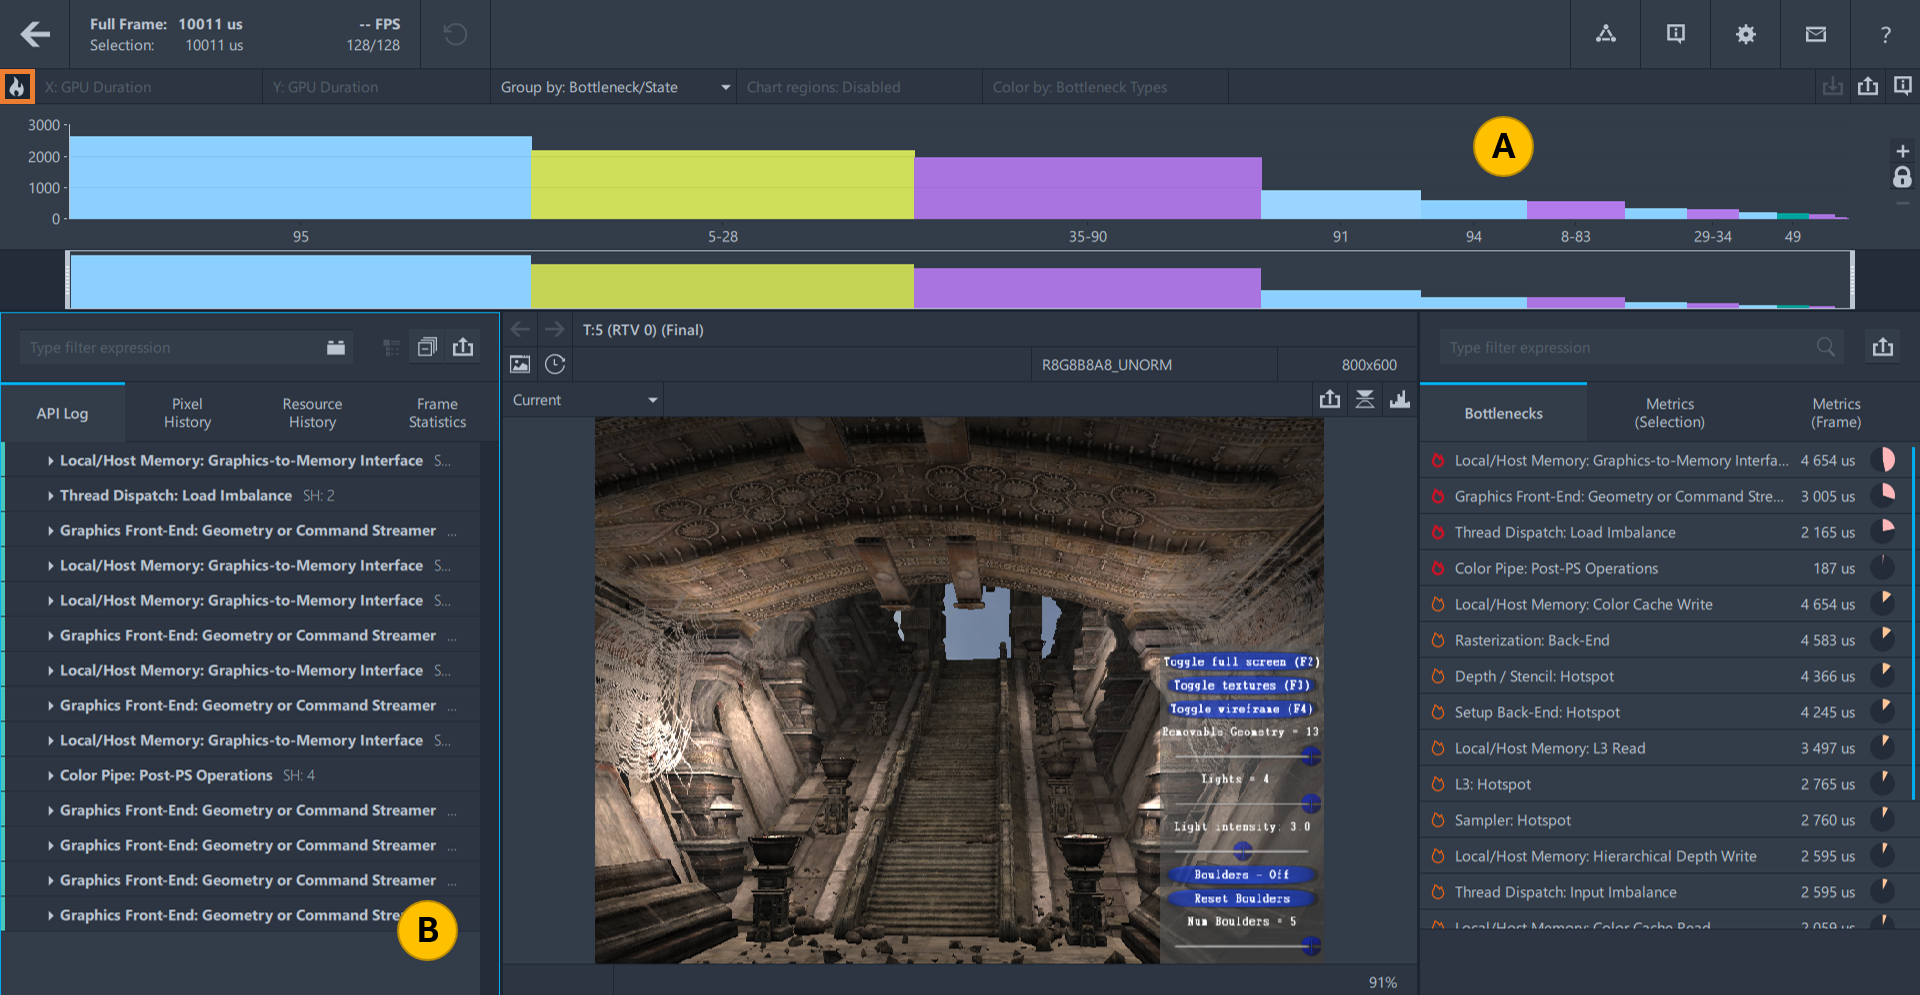
Start resolving issues with the most impactful bottleneck. Click the first group of draw calls either in the Visualization or API Log pane.
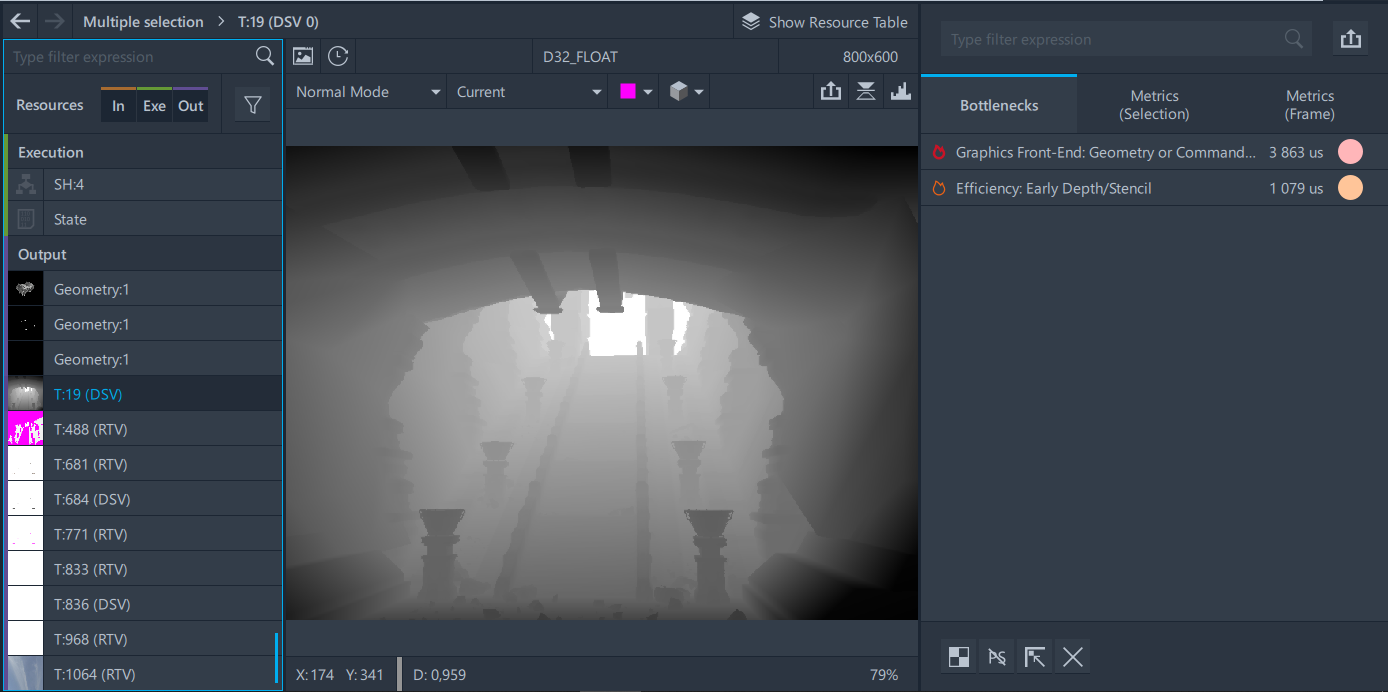
The resources associated with this group of calls appear in the Resources pane. The Bottlenecks tab presents the graphics pipeline color-coded by bottleneck distribution. Red portions of the pipeline indicate main bottlenecks, and orange indicate secondary bottlenecks.
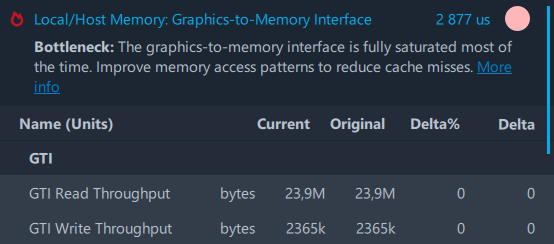
- In the Bottlenecks tab, click the red bottleneck, for example, Local/Host Memory: Graphics-to-Memory Interface. The bottleneck cause, hints, and related metrics appear.
- Once step 10 is done, close Graphics Frame Analyzer window.
As a result, you can identify potential bottlenecks of your application and get hints on how to resolve issues.
Next Steps
To take a closer look at the features of Graphics Frame Analyzer, including working with single and multiple frames, watch short video series In Depth: Graphics Frame Analyzer.
To learn more about frame analysis workflow, refer to the user guide section Analyze GPU-bound Applications with Graphics Frame Analyzer.
To learn about bottlenecks identified by Graphics Frame Analyzer, refer to the cookbook topic Performance Optimization for Intel® Processor Graphics.